Skip to content

Java ProfilerLow-overhead Java profiling for Kubernetes incidents

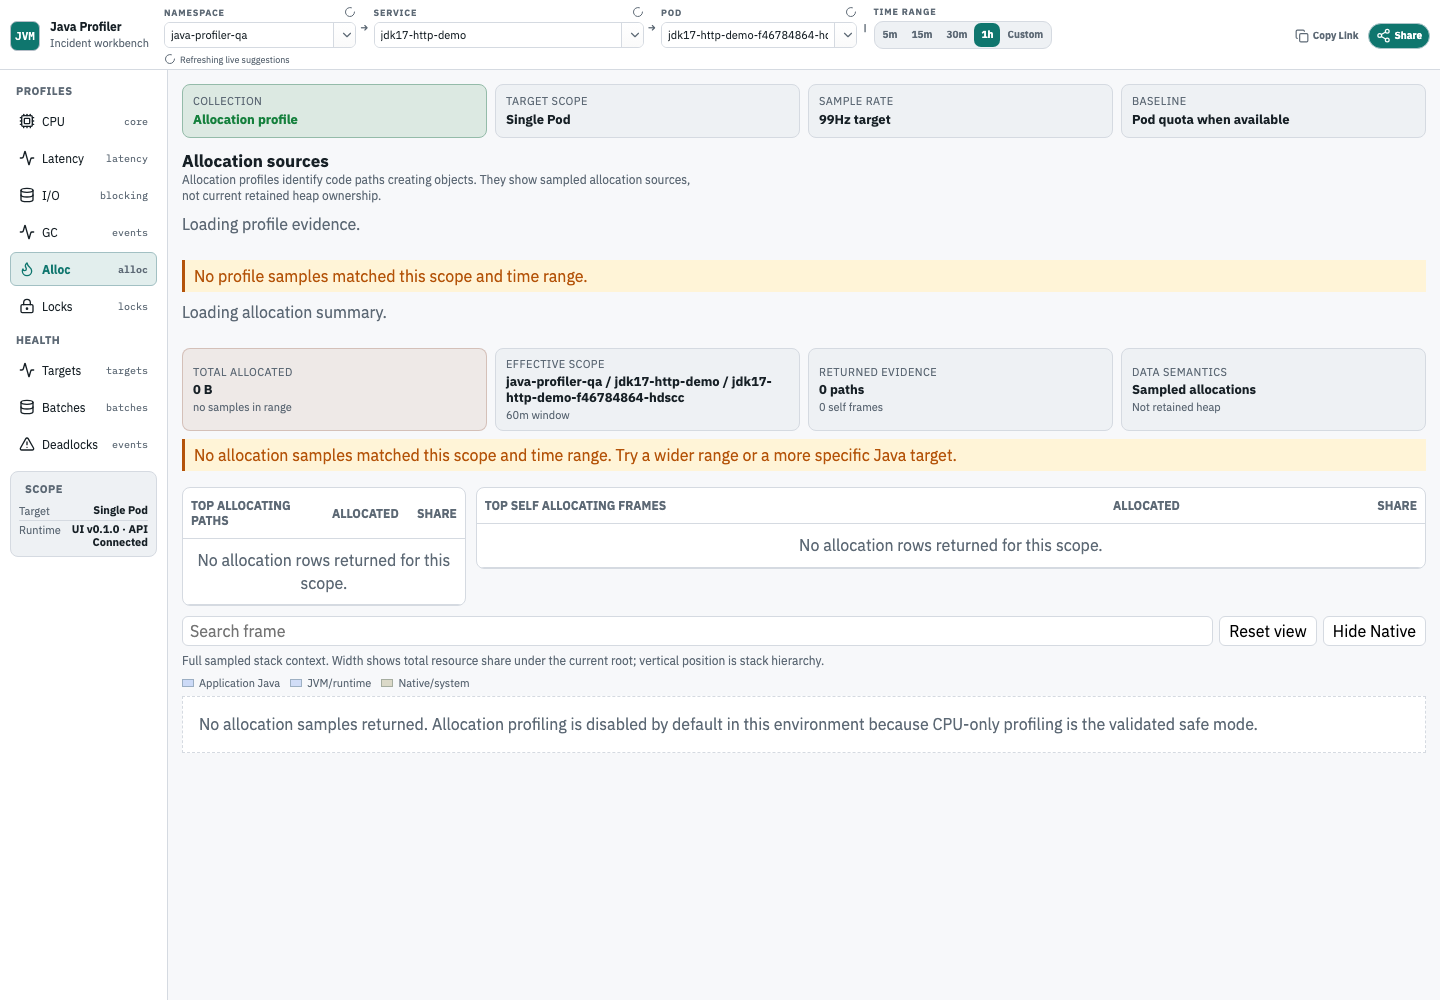
A focused profiler for HotSpot services on Kubernetes: opt-in collection, async-profiler/JFR-derived evidence, ClickHouse storage, and a UI built for Java incident diagnosis.

Docs 中文文档 GitHub stars

Real allocation profile analysis from the acceptance environment

3-minute path

  1. Open Quickstart and enable profiling with Kubernetes metadata.
  2. Open the target service, then check status first to confirm the JVM was accepted.
  3. Move from cpu or memory to wall, io, gc, locks, and ingestion to get from symptom to evidence.

For service owners

  • Quickstart: enable profiling and read your first service profile.
  • Performance Analysis Manual: read CPU, Wall Clock, Java I/O wait, GC, allocation summary, lock, deadlock, target status, profile evidence guidance, and ingestion evidence.
  • Java Profiling Runbook: enable temporary or continuous profiling for a Kubernetes workload.

For platform operators

For contributors

Trust and localization

  • Use the English / 简体中文 switch in the top bar when you want the localized path.
  • The real screenshots on this page come from the acceptance environment, not mocked UI state. The allocation screenshot shows the current Allocation Summary and flamegraph workflow.

Local preview

Run these commands from the repository root:

bash
cd docs
npm install
npm run docs:dev

Build the publishable static site:

bash
cd docs
npm run docs:build

Java services on Kubernetes. HotSpot first. async-profiler first.