Performance Analysis Manual
Use this workflow when a Java service is already being profiled and you need to find the stack responsible for CPU, Wall Clock latency, Java I/O wait, GC pauses, allocation, lock, deadlock, or ingestion problems.
The screenshots below come from a real Kubernetes acceptance environment, not mocked UI state.
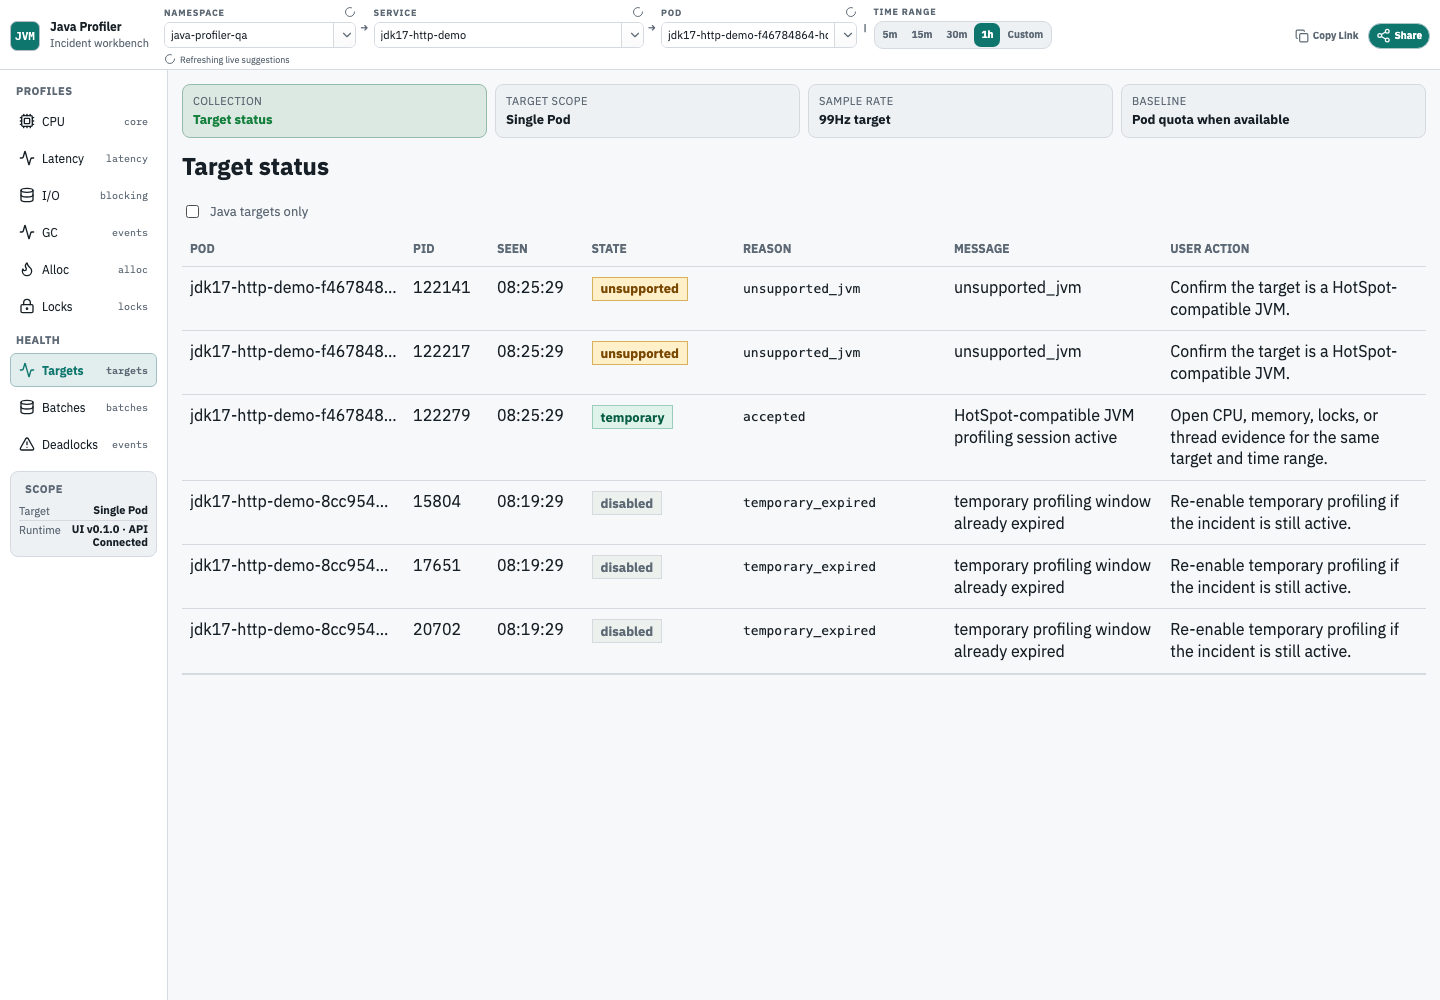
Start with target status
Target status tells you whether the selected JVM was accepted, rejected, disabled, unsupported, expired, or failed attach. Check this before assuming a service has no performance data.
Read profile evidence guidance
CPU, Wall Clock, I/O wait, allocation, GC-correlation, and lock views show a Profile evidence status banner when the selected profile has no samples. The banner is not a substitute for real profile data. It explains the next check:
profiling_disabled: the target is visible, but profiling metadata disables collection.temporary_expired: the selected temporary profiling window has ended.no_matching_target: the namespace, service, Pod, or time range does not match a known Java profiling target.ingestion_gap: aggregate ingestion health has rejected, retryable, dropped, or truncated profile batches.no_samples_in_range: target and ingestion evidence exist, but no samples match the selected scope and time range.
Use it to decide whether to fix metadata, choose a different target, widen the range, or inspect ingestion. Do not treat an explanatory empty state as strict acceptance evidence.
Investigate Pod OOM or memory climb
Use the OOM / memory-pressure workflow when a Java Pod is restarting, was recently OOMKilled, heap usage climbs, allocation rate rises, or GC pauses line up with user-visible latency.
- Select the namespace, service, Pod, and incident time range first. Pod scope gives the cleanest status and allocation evidence.
- Confirm target status.
acceptedmeans profiling can proceed;oom_killed_seen,container_restarted, andprofiling_window_after_restartare Kubernetes crash-context evidence, not retained-heap proof. - Check ingestion freshness before interpreting missing samples. A stale or rejected profile batch explains why allocation evidence may be absent.
- Read GC pause evidence next. GC events show JVM pause activity in the same selected window.
- Use sampled allocation totals, Top allocating paths, Top self allocating frames, and the allocation flame graph to find object-creation pressure.
- Treat allocation profiles as sampled allocation sources, not retained heap ownership. Do not require production heap dumps for the default investigation path.
- Use CPU profiles only after allocation and GC evidence do not explain the incident.
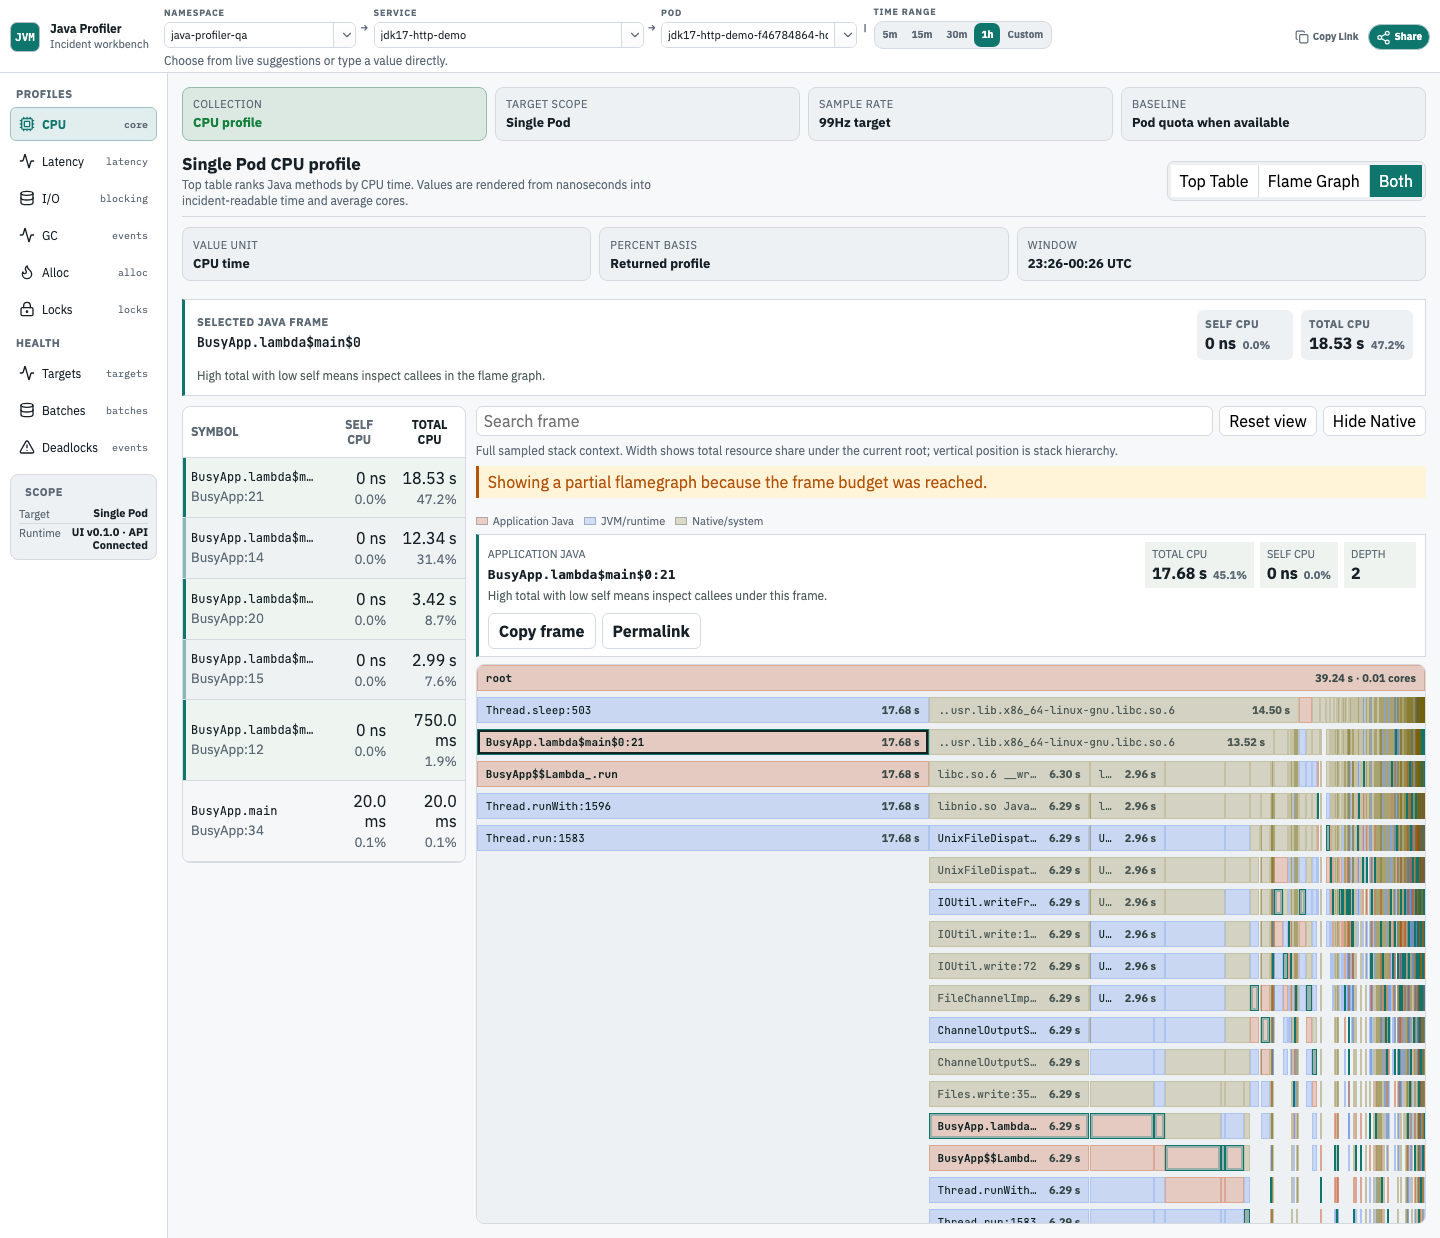
Analyze CPU profiles
Use the CPU view when a service has high CPU or latency that may be caused by expensive Java code.
- Top Table shows the most expensive Java symbols.
- Self CPU is time spent directly in that frame.
- Total CPU includes callees under that frame.
- Flame Graph shows sampled stack context.
- Both mode keeps the Top Table and Flame Graph visible together.
- Search highlights matching frames without hiding the rest of the stack.
- Focus narrows the graph to the selected stack path.
- Start in Both mode. Pick the top Java row first, then use the highlighted Flame Graph frames to see where that Java method sits in the sampled stack.
- High Self CPU means the method's own work is the first optimization target. High Total CPU with low Self CPU means inspect callees before changing the method itself.
- Runtime and native frames can stay visible in the Flame Graph because they explain where samples landed, but the Top Table should keep the default optimization target on application Java.
- Very narrow Flame Graph blocks may not show text. Hover, click, or keyboard-focus the block to inspect the full frame name, category, CPU values, and percentages.
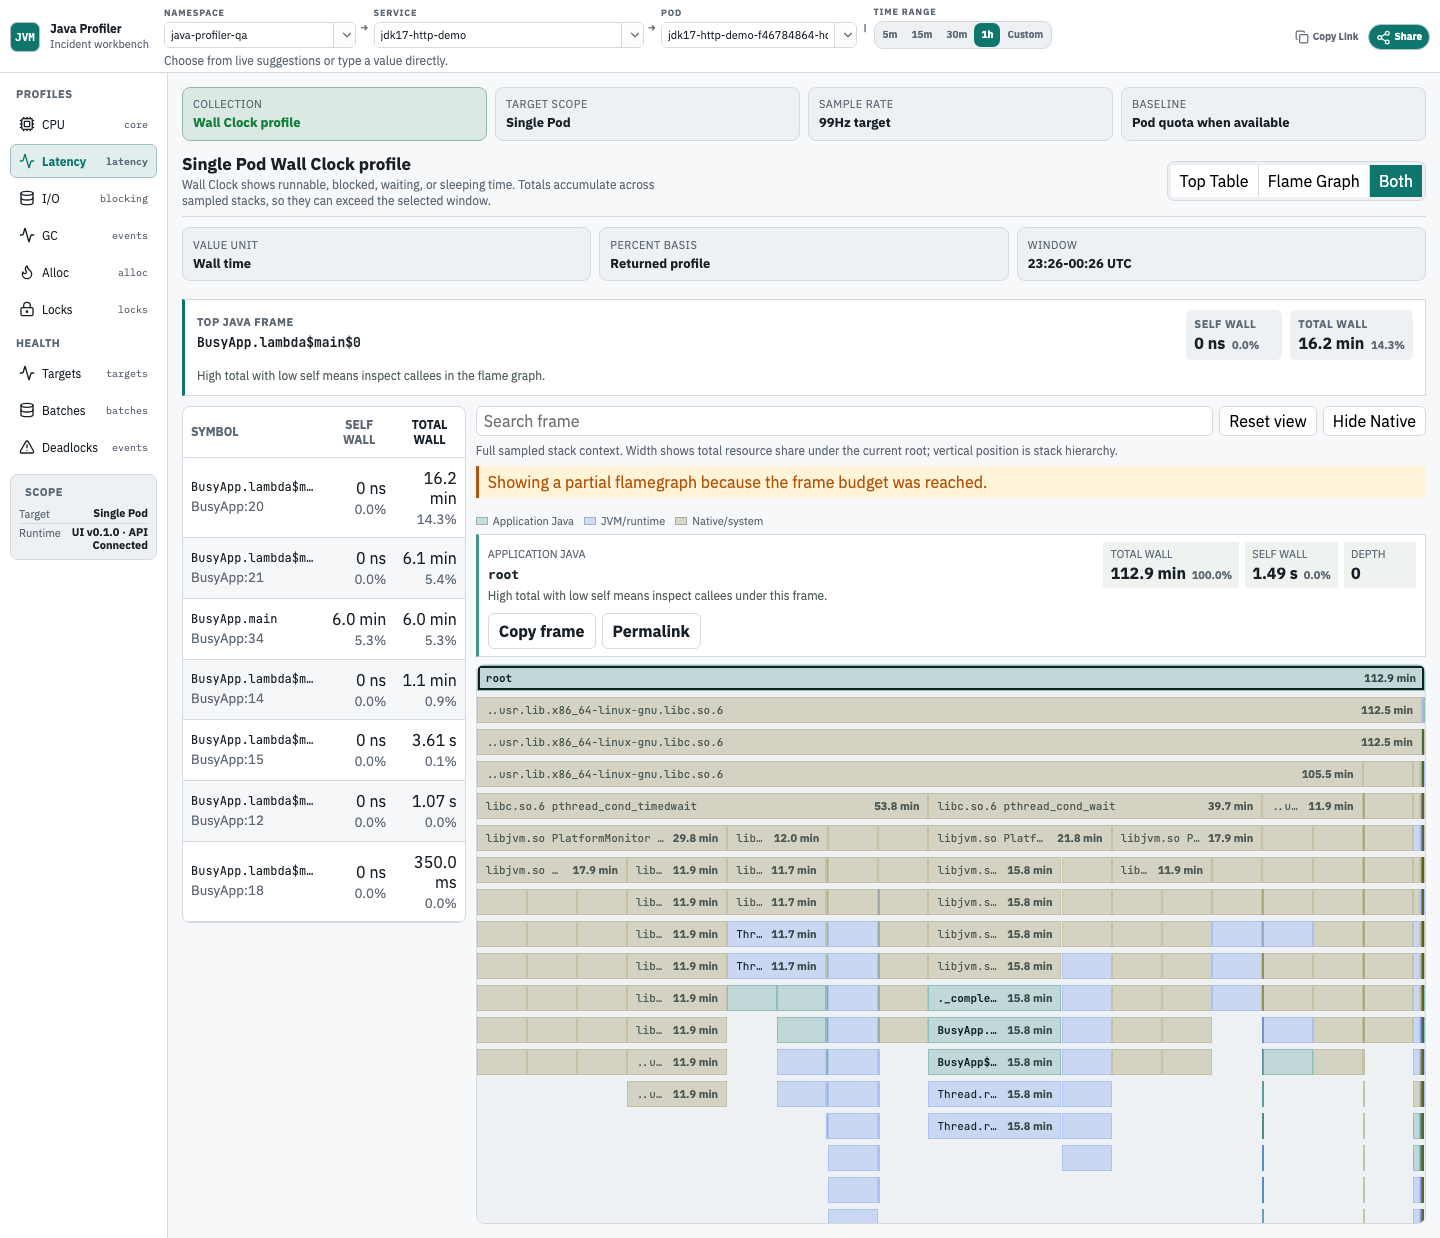
Analyze Wall Clock latency
Use Wall Clock when latency is high but CPU does not explain the full incident. It shows Java stack time that may be runnable, blocked, waiting, sleeping, or doing I/O.
- Compare Wall Clock with CPU before declaring a method CPU-bound.
- Use the same Top Table and Flame Graph controls as CPU.
- Treat Wall Clock as latency evidence, not as CPU utilization.
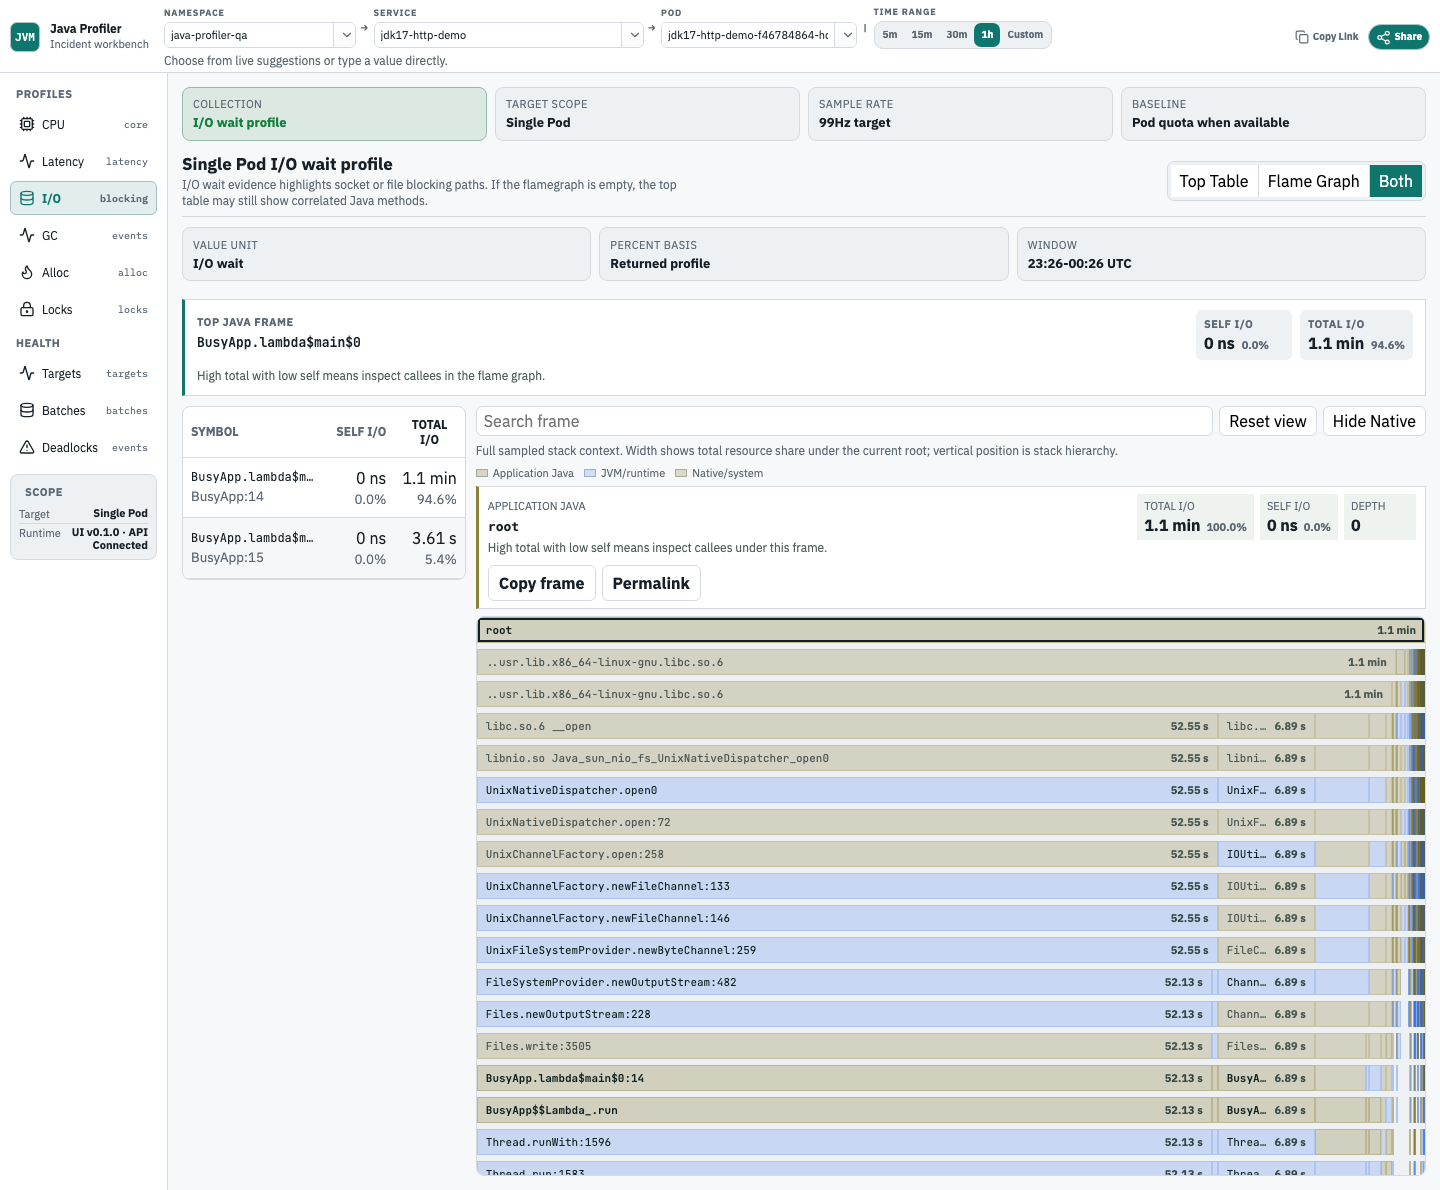
Analyze Java I/O wait
Use I/O wait when a service is blocked on sockets, files, or Java-owned network clients. The view only claims Java ownership when the collected stack preserves JVM/JFR evidence for the blocking path.
- Start with top Java I/O symbols.
- Drill into Flame Graph context to separate business code from runtime or native frames.
- Cross-check remote dependency latency outside this profiler when the stack points to RPC or storage clients.
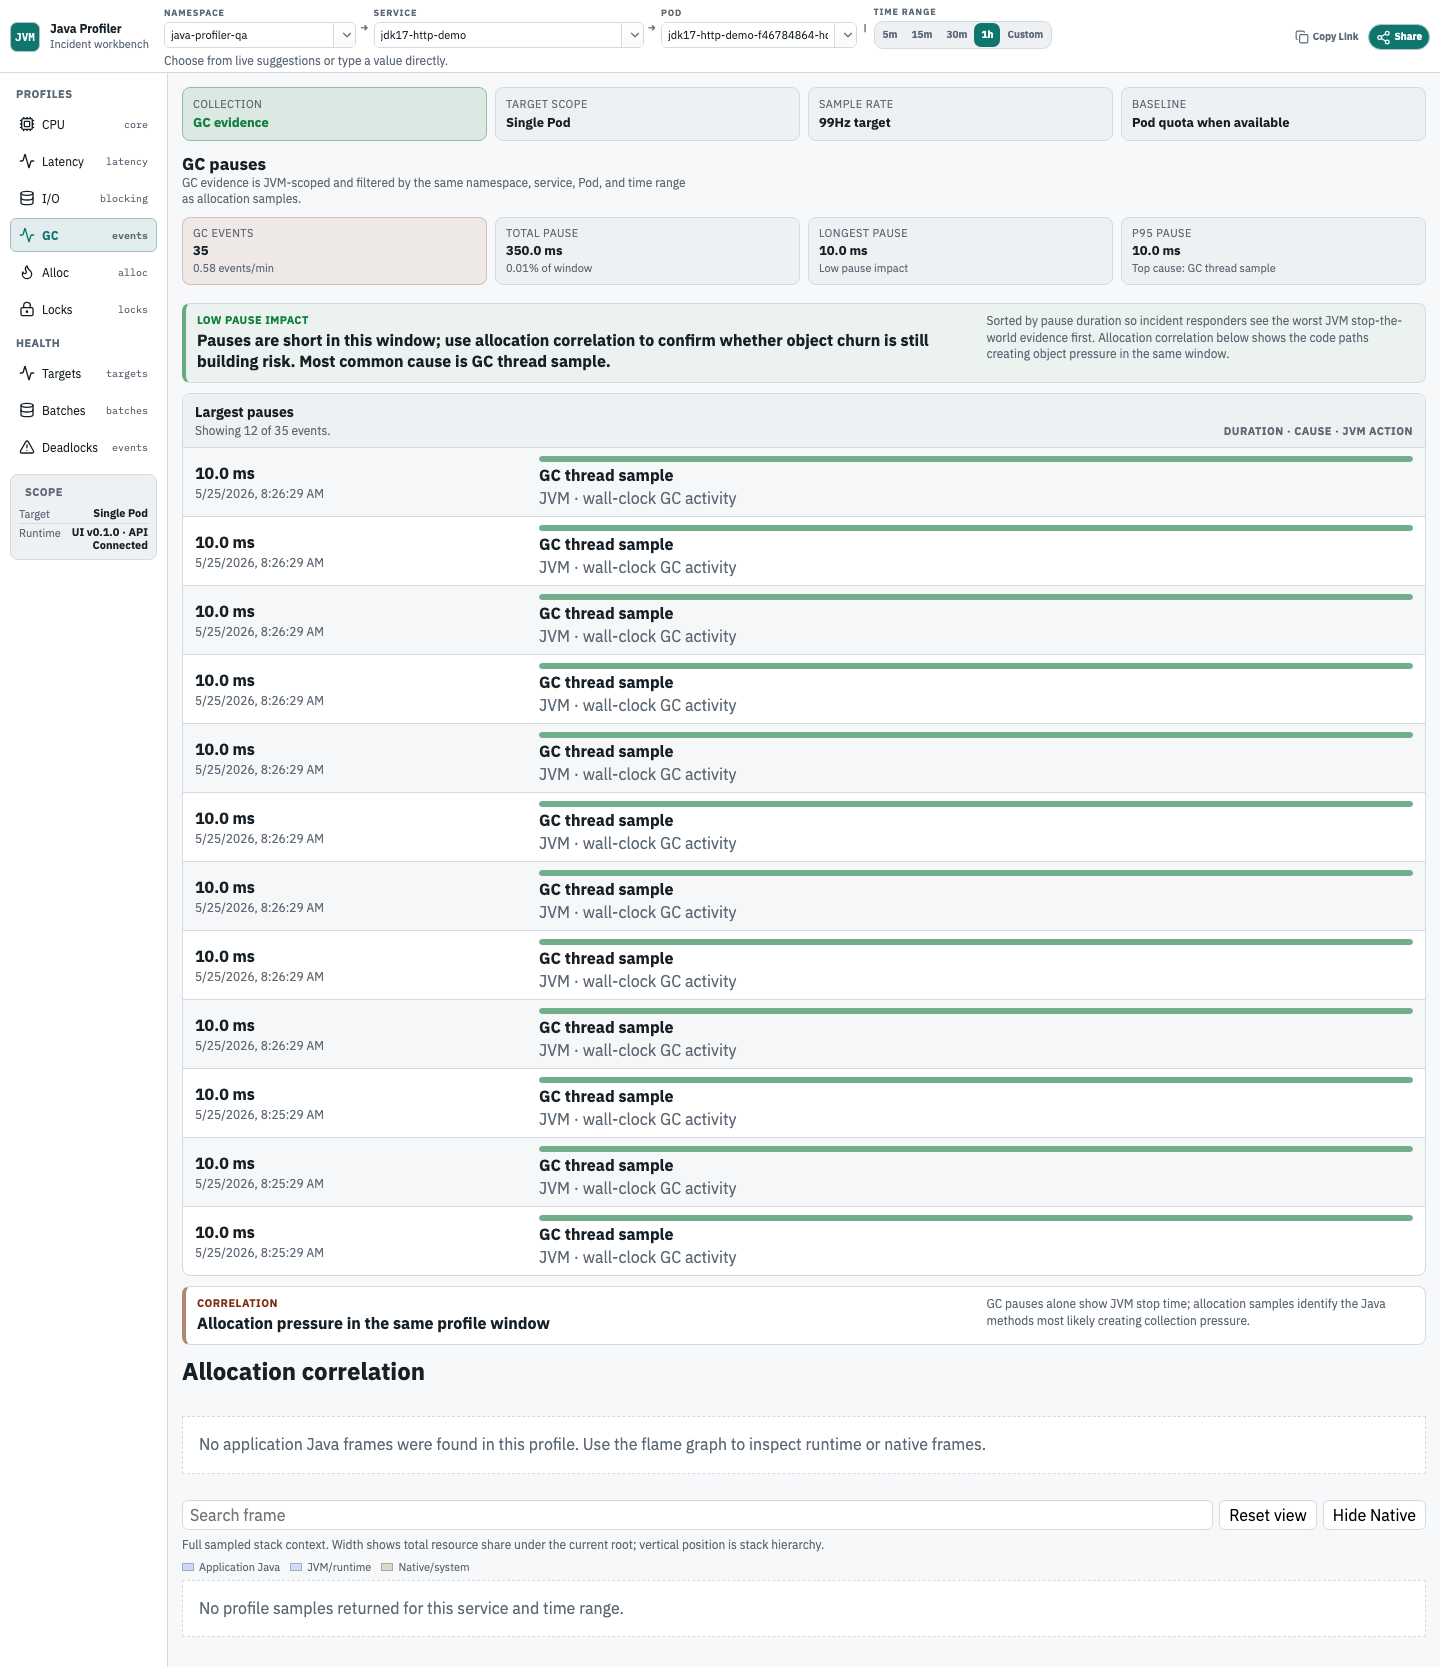
Correlate GC pauses and allocation pressure
Use GC pauses when request latency or throughput changes line up with JVM pause activity. The GC view shows JVM GC event evidence beside allocation profile context for the same service, Pod, and time range.
- Confirm that GC events exist for the selected time window.
- Use allocation correlation to find Java paths creating pressure.
- Do not treat allocation profile size as retained heap ownership.
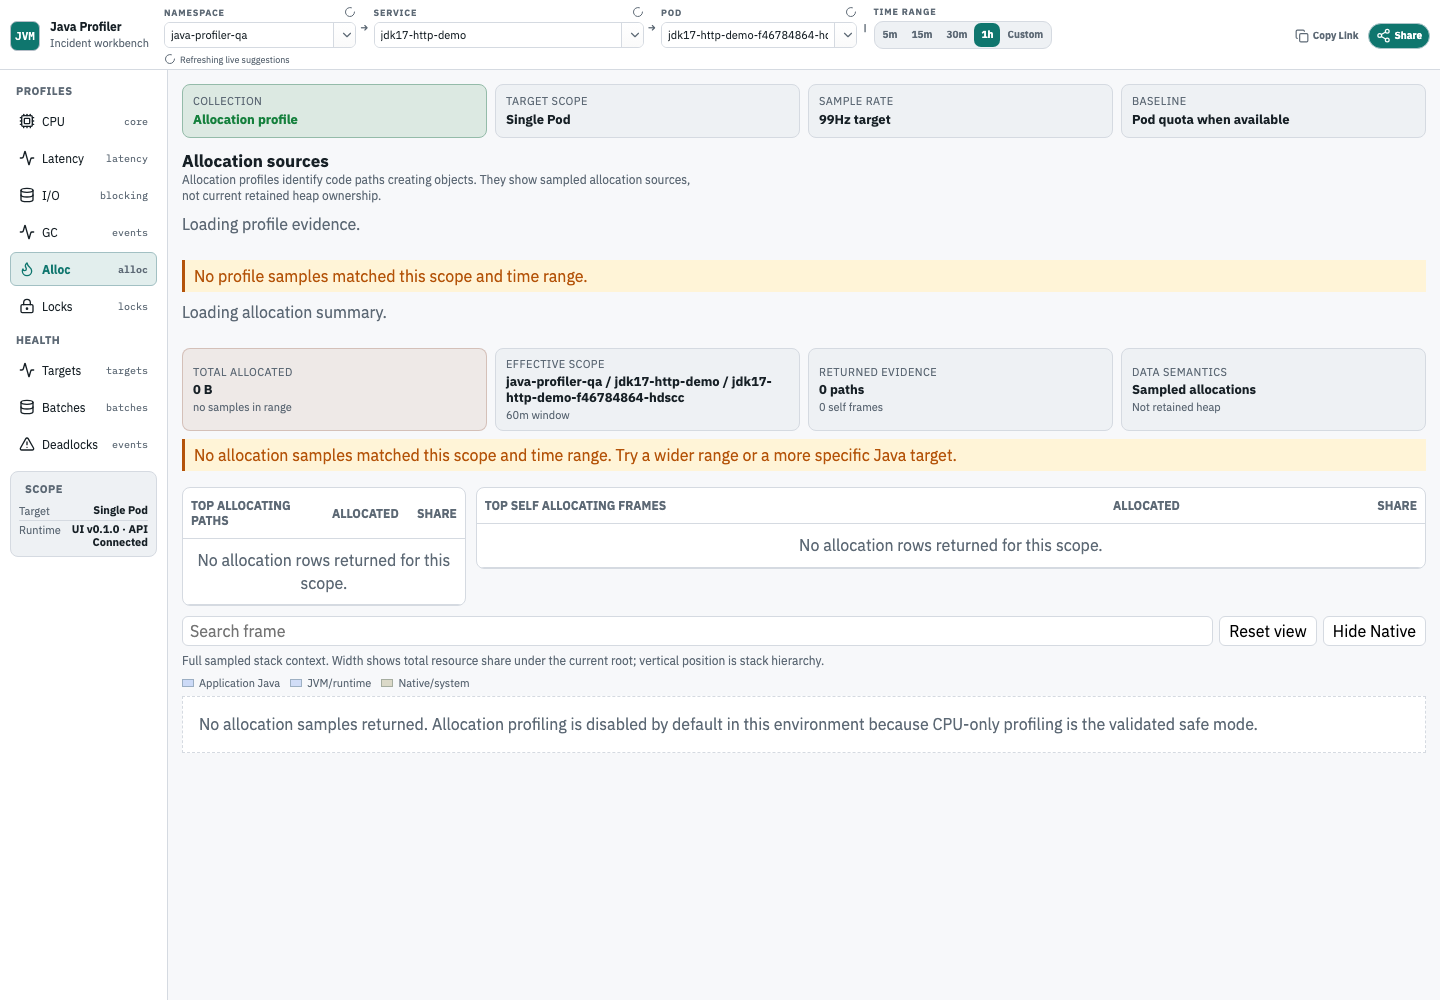
Analyze allocation pressure
Use allocation profiles when heap usage, allocation rate, or GC pressure rises. Start with Allocation Summary, then inspect the stack paths that lead to those allocations.
- Allocation Summary shows total sampled allocation, effective scope, returned path/self-frame counts, insight categories, and partial-result limits.
- Top allocating paths rank leaf allocation paths by total allocated bytes.
- Top self allocating frames rank frames where allocation is attributed directly to that frame.
- Allocation profiles show where object creation happens under the selected service and time range.
- Use the flame graph to inspect full sampled stack context before deciding which call path is responsible.
- The latest allocation acceptance screenshot shows the current wide layout with Allocation Summary, Top allocating paths, Top self allocating frames, and flamegraph context.
- Empty allocation states distinguish disabled profiling, unmatched targets, ingestion gaps, unsupported runtime, missing stack frames, and ranges with no samples.
- Namespace-only Allocation Summary queries are limited to 30 minutes; select a service or Pod, or shorten the range. All allocation summary queries stay within the 7-day retention limit.
Analyze lock contention
Use lock diagnosis when request latency or thread state suggests blocking. Lock-delay profiles point to synchronized or monitor paths where threads spend time waiting.
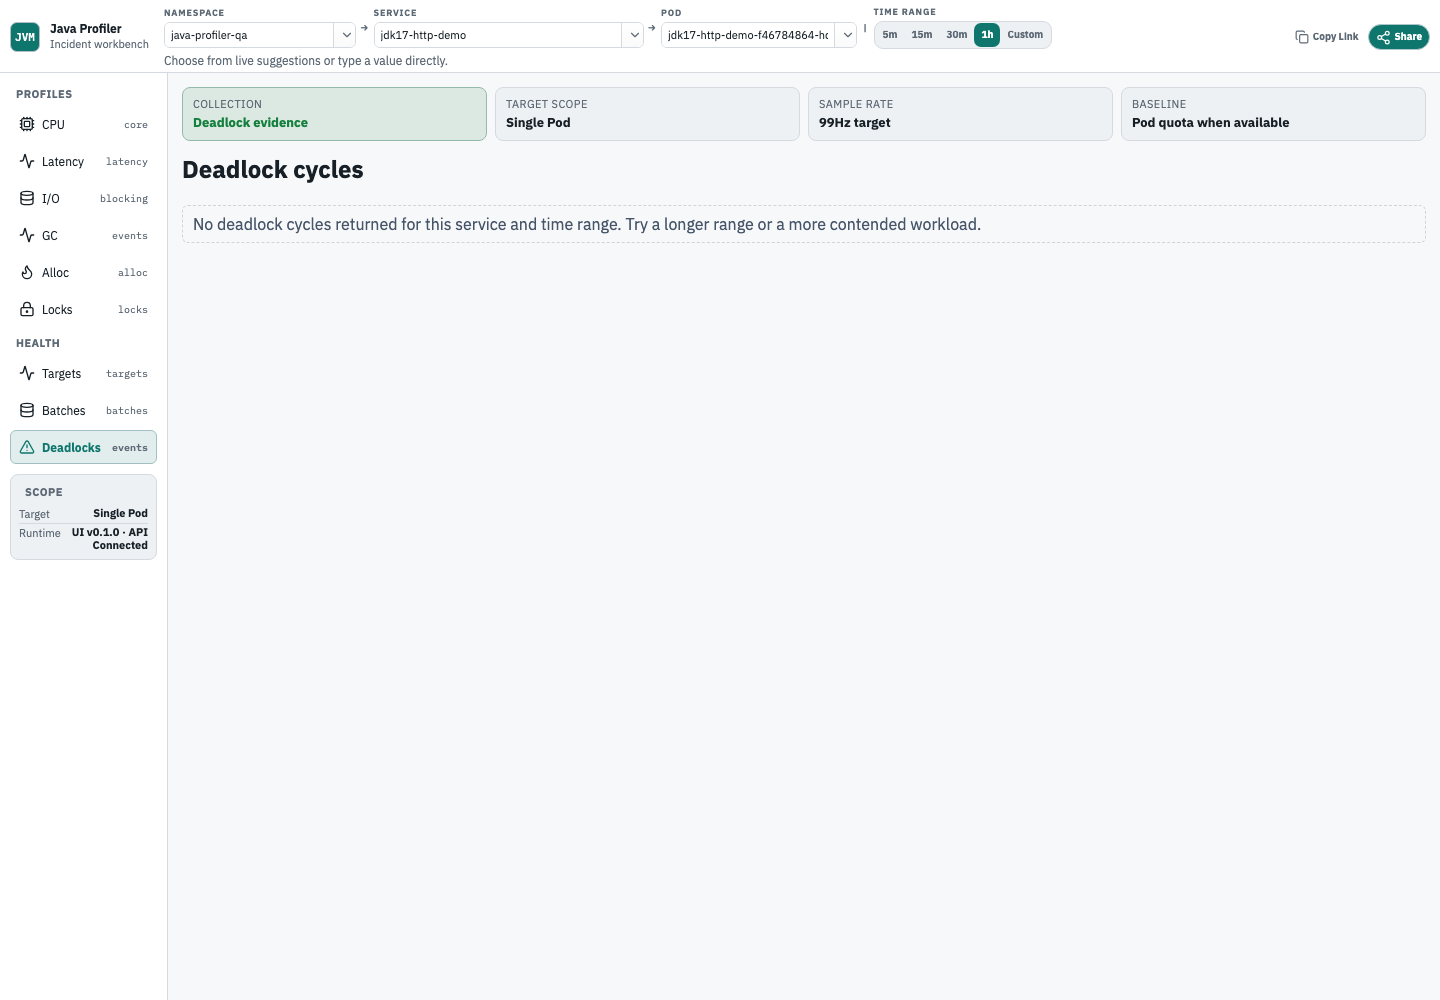
Check deadlocks
Deadlock diagnosis shows cycles reported by the target JVM. A real run may show cycle evidence or a verified empty state for the selected time range.
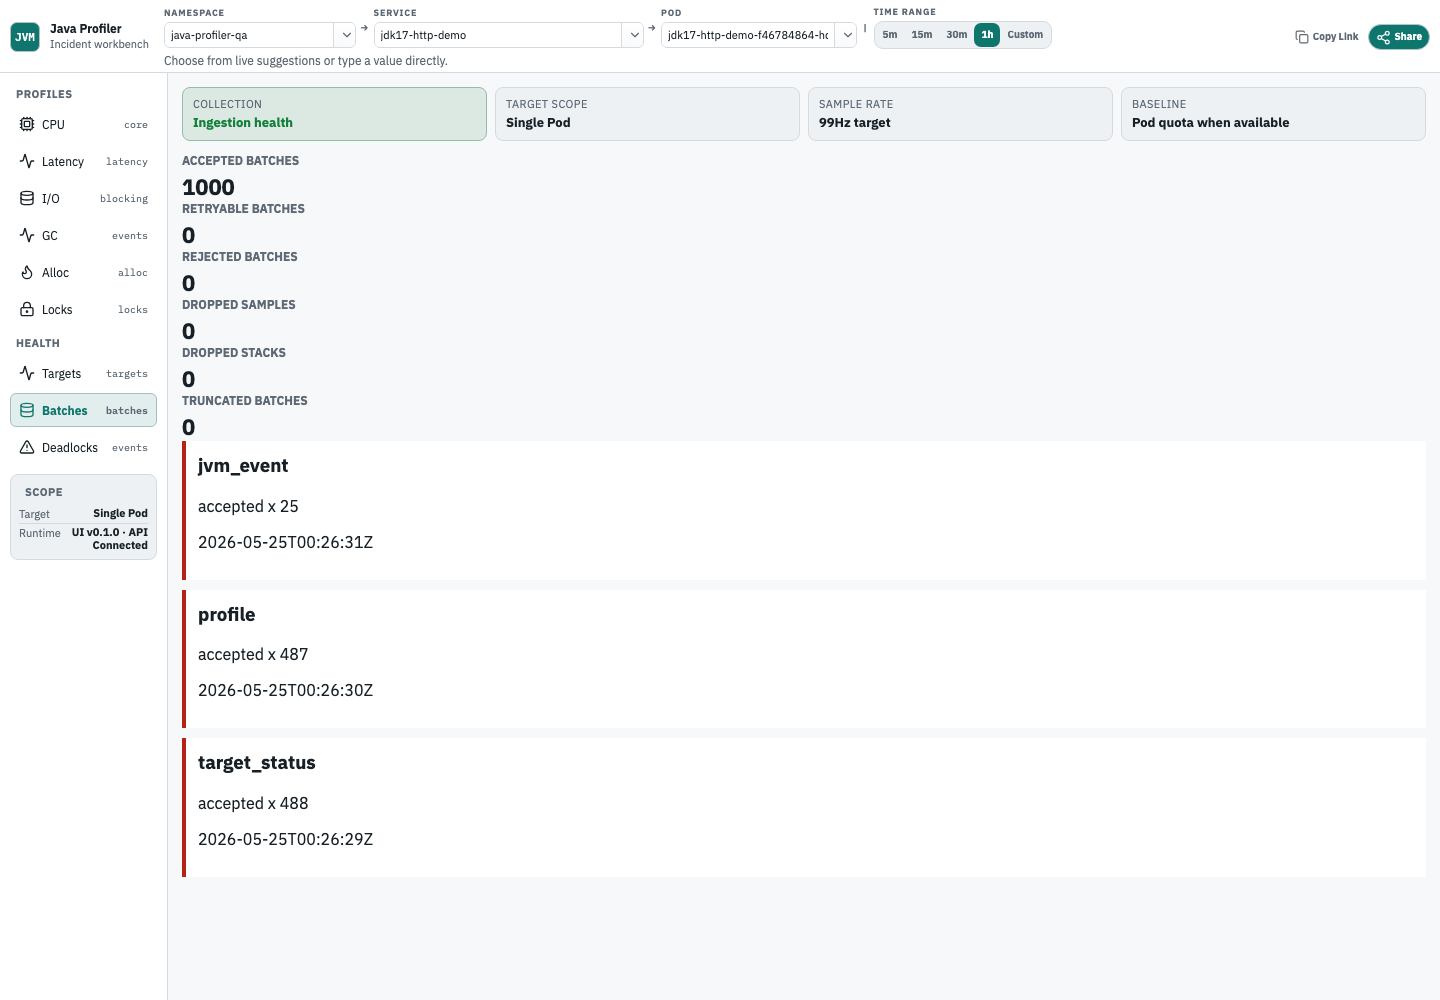
Check ingestion health
Ingestion health closes the loop. It shows whether profile batches were accepted, rejected, dropped, or truncated by the backend ingestion path.
When the UI is empty
Check these in order:
- Target status: is the JVM accepted?
- Profile evidence status: does it report disabled metadata, expired temporary profiling, no matching target, ingestion gaps, or no samples in range?
- Service and namespace: do they match the workload metadata?
- Time range: does it include the profiling window?
- Ingestion health: were profile batches accepted?
- Runbook: follow Enable Profiling to verify metadata and collector behavior.